COMPASS Dilution
Refrigerator
Slow Control Manual
|
F. Gautheron / 2003
Preliminary remarks
The slow control system has been developped with LabView 6.1©. Few parts of this program are not allowed to run with a previous LabView version or another plateform than Windows©. It is particularly the case for the parts devoted to the web and databases connections.
Where to find the code?
The master copy is kept in the Computer Center under DFS network. The running copy is stored in the PCCODT10 computer, which is dedicated to the acquisition for the dilution refrigerator. If the slow control window is not already opened on the screen, you can find it at the following address:
C:/PTmonitor/
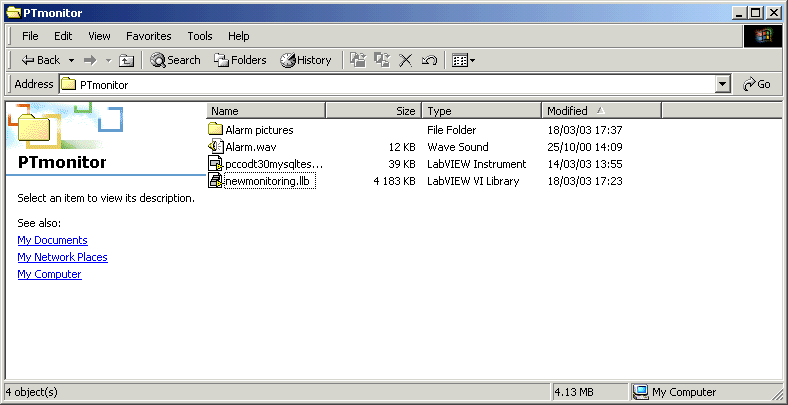
The file newmonitoring is, in fact, a dynamic library containing the main control and everything needed to run it correctly. When you double click this file, LabView starts and loads this library. About 10 seconds are needed to see the main slow control window appearing on the screen.
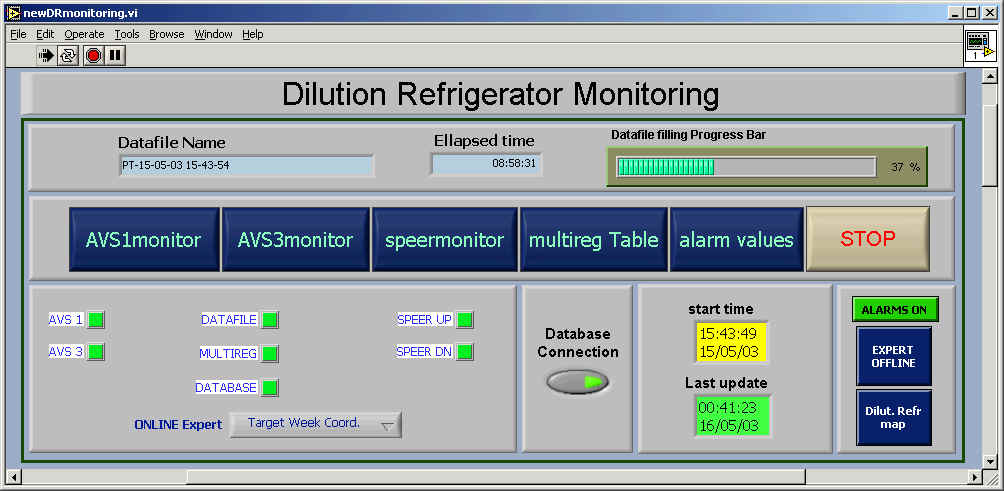
newDRmonitor is the main control program, which manages about 230 subprograms to control the dilution refrigerator, to communicate with the databases and with other computers in the control room.
Few other subprograms in this directory are used to store or transfer some values between sub-processes and are needed by the main program. Please don’t remove anything from these directories.
How to start the slow control?
About the GPIB hardware
Before starting the slow control, you must switch ON all measuring systems i.e AVS 1, AVS 3, Speer Up, Speer Down and Mutireg system. If you don’t do it, no data will be taken, even if you switch ON these measuring systems after starting the slow control.
About the software
After double cliking the library file, LabView shows you the front panel of the central monitoring system. At this time nothing is started yet. You must click on the small arrow on the top command menu to start the program.
What are the components on the Front Panel?
The front panel is divided into 6 parts:
General stop button
By pressing this button, you will immediately send the order to all the slow control software to stop. The stopping operation takes about 2 minutes. At this time, the general stop button turns grey and no other operations are allowed.
Datafile informations
This part is made of 3 elements:
- An indicator gives the name of the datafile in production, composed with the date and the time of its creation.
- The elapsed time indicator is given from the beginning of the present filling.
- A progressive bar shows precisely this data filling
Status and controls
The second part is made of buttons and LEDs:
- Blue/Grey buttons open the windows to show the online monitoring of each part of the measurement system. Depending on the different delays needed for each system, they are not updated in the same time (2 minutes for AVS3, 30s for the multireg). The opened window contains the dedicated close button.
- The last Blue/Grey button ("ALARM VALUES") is dedicated to settings of alarms. These settings have no effects until you choose to activate them by pressing the corresponding red buttons ("ALARM OFF/ALARM ON", when the alarms are activated, the button becomes green).
- LEDs give the communication status of the monitoring for all components of the measurement systems (AVS, multimeters, ...). If one of the LEDs is red (or more), please STOP and RESTART the slow control. If after restarting these LEDs remains RED (wait ~10s)m please call the Target Week Coordinator.
Starting status
Due to the different delays used by the measuring systems, all measured values are not available immediately after starting the slow control. To avoid the activation of alarms on random values from the beginning, the alarm ON/OFF button is disabled during approx 3. first minutes.
Database Connection
The operator can activate the connection with the databases and the WebServers. In the normal operation it must be switched ON in order to ONLINE inform the collaboration about the status of the polarized target. It also the way to regularly update the e-logbook for future analysis.
Expert Offline/Online
This button must be pressed when you want to activate the possibility of automated call for the expert in case of problem. A SMS is automatically sent by the slow control system to the expert's mobile phone in case of alarm(s).
Even if an alarm message is repeatly displayed on the computer console until you have the correct hardware action to cancel the alarm, the slow control sends an SMS alarm message regularly every 3 minutes.
Dilution Refrigerator Map
By cliking this button, you'll open the window containing the overview map of the refrigerator, locating every gauge and thermometer. This map provides the online raw measurements and their corresponding temperatures in deg K. Note that the window is also viewable by internet when this window is displayed.
What informations are displayed on device panels?
Each device has a dedicated status panel with all displayed parameters . The graphical window shows the history of the signal for each channel of measurement over 4 hours. You have the possibility to select all channels or only few ones, but the acquisition is not stopped for the hidden channels. The table on the right side gives the numerical values for each channel after a complete scan. The most right table gives the physical values in Kelvin. The calibrations are only available for low temperatures (usually <5K). Above this temperature the value "-99 K" is displayed standing for an out of range. The button "Close" is used only for closing this window. The data acquisition process will not be affected by this action.
The control arrays "Range" and "Excitation" are used for a fine tuning of the sensitivity of the measurement apparatus. It is normally set by the experts or by the Target Week Coordinator. If one of these parameters are changed, it must be stored in the computer memory by pressing the yellow button "parameters into Memory". The new values will be taken into account also for the next restart if it must happen later.
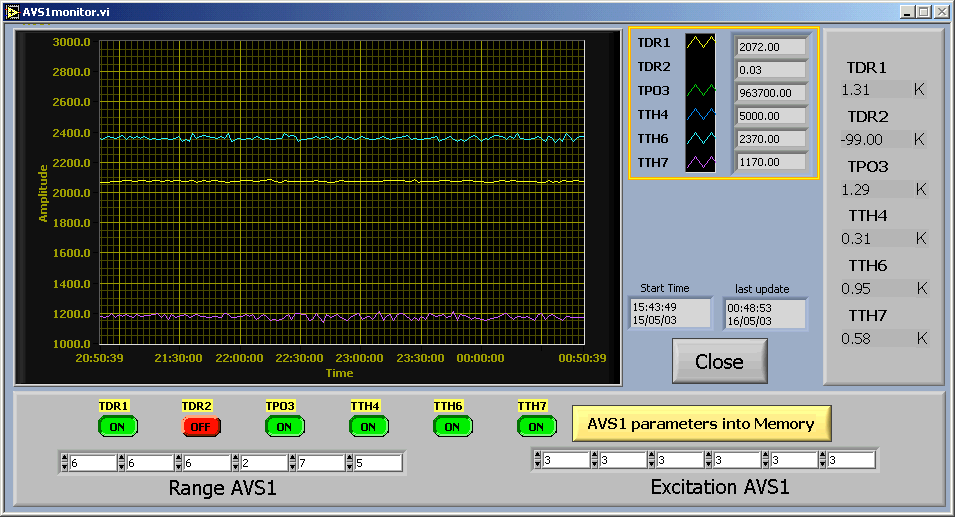
The slow control panel dedicated to the AVS 1 resistance bridge device. All the channels are shown over 4 hours of history.
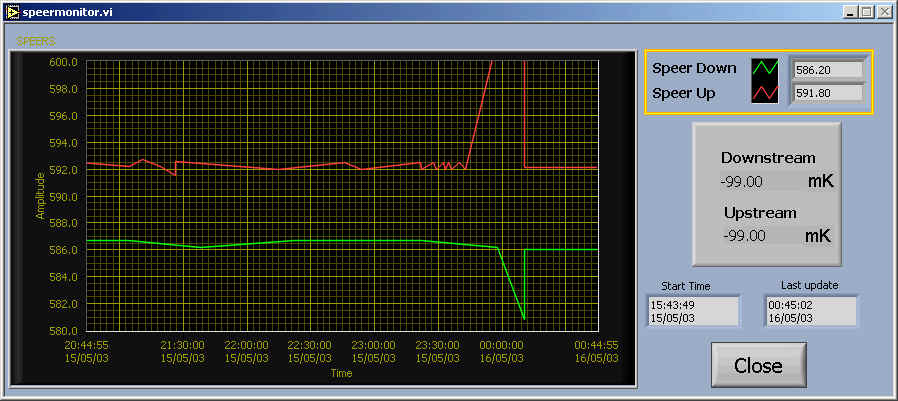
The slow control panel of the speers measurement systems.
Alarms values
By pressing the button "Alarm Values" you open this following window, which has a red frame. The default position for individual alarms is the previous ones kept in the memory.

Several tabs are available and give all categories of alarms (Mixing chamber, Pump pressures, ...). For each of them, you can see the min and the Max values and if the alarms are individually switched ON/OFF (slide switchers in front of limit values).
When an alarm occurs, a corresponding message appears in the alarm box, giving the parameter which has under/overcome its limits. For example:
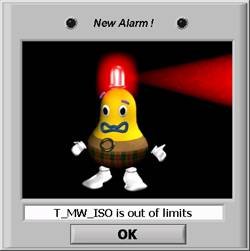
You have to click on the OK button to close this window and to stop the horn, but if nothing is done to modify the value of the parameter or its limits, this message will reappear very soon.
What about datafiles?
· A new datafile is periodically created. Its name is composed of 3 parts: PT-Date-Time of the creation. For example: PT-10-08-01 13-24-52
· The datafile is updated every 115 seconds
· The storage directory is located at: C:\Data\ (16 Go available, 1 datafile for 24h ~500Ko)
· All datafiles, including the datafile in production, are accessible for others applications in read-only mode. For security reasons and data integrity, it is better to make a remote copy of the files if you want to work with.
· The datafiles are in ASCII format, easily readable by all applications. They are not automatically compressed and have to be manually done if needed.
Operation status published on the Web
The main program permanently fill an Oracle database to provide a Web-presentation of the status of the Dilution Refrigerator and the history of each parameter.
· A table reports the online status of all components used to cool down and keep cold the target. You find the exhaustive list of parameters, the raw values measured and the corresponding physical values at low temperature. An alarm information for each channel is also reported on this table. On http://cern.ch/compass-target/ you’ll find a button for DR Status.
· A map of the refrigerator, localizing the measurement points, the names of thermometers and their online values measured.
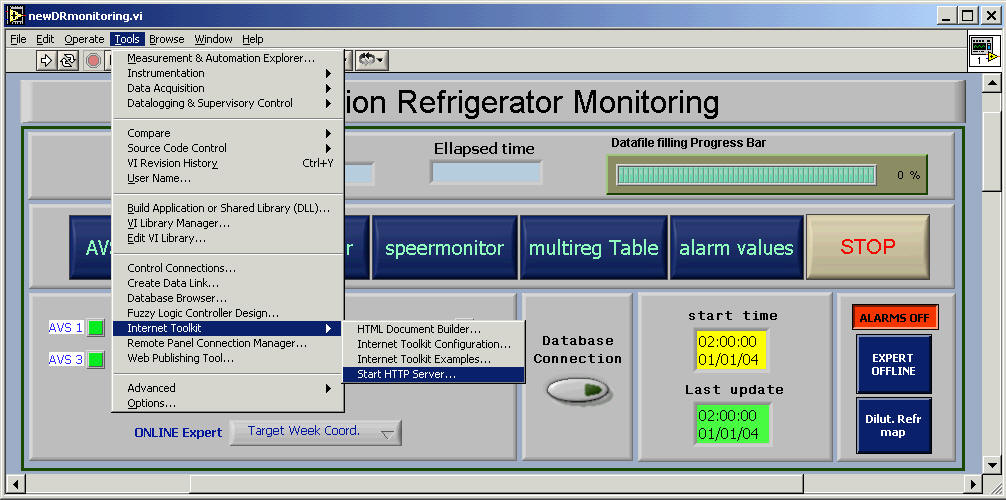
· A picture for the different graphical interface windows are also available on the web and periodically updated, giving the possibility for the collaboration to follow online the evolution of the parameters. In 2003 these windows are word wide viewable (select DAQ windows at http://cern.ch/compass-target/). To allow this access, you must start the HTTP server on the PCCODT10 computer. It can be done from the panel menu bar, in the "Tools" pop-up menu:
After few seconds, you will see this new small window on the screen:

For example, by pressing the "Dilut. Refre map" blue button on the main display, the following window appears in the screen and is available on the web in the same time.

By pushing the "Close" button, you will also close the web-connection for this view. In the case that you want to hide this display it is much better to minimize this window. The picture will then continue to be updated and accesible from internet.
Data exchanged with other control systems
The temperature status of the target is required to set the NMR system. The data are periodically sent by DataSocket connection. By default, the DataSocket server is switched OFF. You must switch it ON by yourself following the procedure:
Start -> Programs -> National Instruments -> DataSocket ->
DataSocket server
What to do when the slow control is blocked?
In this case, pushing the general stop button will have no effect on the process. The only way to escape from this situation is to use the emergency stop red button in the top bar. It may happen that the different windows appear empty during 1 or 2 minutes afterward. From this point, you can restart directly the slow control (procedure How to start the slow control?). If you decide to quit Labview, it will give you the possiblity to save the very last version of the slow control (not the data!). You MUST refuse to do it to guarantee the integrity of the source code.
Architectural overview of the target slow control network
